The answer, like most things from Statistical Process Control, is more surprising and more obvious than you might think.
This is a companion discussion topic for the original entry at https://commoncog.com/how-to-become-data-driven/
The answer, like most things from Statistical Process Control, is more surprising and more obvious than you might think.
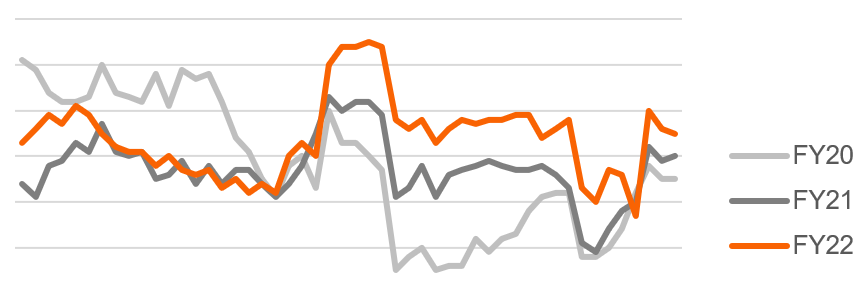
I loved this post and its predecessor. Definitely going to pick up the variation book as recommended. My team struggles to come up with insights because we are looking at patterns across up to 2,000 store locations, each with 5-15 POS systems. Establishing the “normality” so we can see the abnormal deviations could be tremendously helpful. Here’s an example graph I report on every month but have yet to actually produce a meaningful insight about.
The spike this year in the middle of that last trough is easy enough to see, but I’m wondering where else things are hiding in plain sight. I’m also wondering if we could smooth the graph out through the year, and how we would approach it.
Glad to be of service!
To repeat myself, and to underscore my recommendation to whoever reads this thread — I highly recommend reading the book, or diving into other materials that I’ve linked to in the appendix, because there are edge cases that the book and various tutorial materials cover that you have to deal with when creating your own XmR charts.
Consider this piece an ‘appetite whetter’, if you will, instead of a detailed how-to guide. I couldn’t do both for fear of exceeding an acceptable word count!
I bought a Kindle version of the book last night and went to start it, and it was a really crappy scan of the book, oriented the wrong way, and so low resolution that it was unreadable. It was very disappointing for sure
I had the same reaction as you, Cedric, when reading this. How can this be simultaneously so simple, profound, and yet this is the first time I’m reading about it in over a decade of working in tech—which is an industry that’s all too boastful about being “data driven”.
Damn. Mind blown.
You can get it on loan at archive.org Understanding variation : the key to managing chaos : Wheeler, Donald J : Free Download, Borrow, and Streaming : Internet Archive
If this is weekly sales per store it is likely too coarse grained for a meaningful process control. You need to focus on a specific process.
The above graph is for time to check out, so it’s a little more specific of a process. I’ll likely drill down into specific types of transactions where there are associates involved. I do need to look at one of Wheeler’s other books for info on “deseasonalizing” the data as well.
Time to checkout in a physical store? What process is this measuring?
I’ve bumped into bits and pieces of this before, but neither the synthesis nor the rationale for a ~3 sigma band to measure variation. I’ve ordered the book, and will read it sometime in Q1.
Meanwhile, if anyone has ideas RE: how to sell the notions ‘tweak what’s not working’ and ‘rethink what is working,’ I’d love to hear your thoughts.
To be clear, the book doesn’t cover the justification for the ~3 sigma band (and in fact doesn’t explain that the scaling factors approximate 3 sigma, to my frustration!) I suspect Understanding Variation is very carefully written for a non mathematically-minded, business audience, and Wheeler’s more statistics heavy publications are saved for his website.
Apparently 3 sigma variation is enough to filter out all the noise in a predictable process. I found this succinct explanation:
How is it possible that three-sigma limits filter out virtually all probable noise? While there are certain mathematical inequalities that guarantee most data sets will require at least 95 percent of the values within three standard deviations of the average, a better rule of practice is the Empirical Rule, which states that about 99 percent to 100 percent of the data will be located within three standard deviations, either above or below the average.
https://www.qualitydigest.com/aug/wheeler.html
And if you want a deeper dive:
https://www.qualitydigest.com/print/12961
I shared this response in an email to Cedric, and he suggested I share it here as well:
I hadn’t gotten around to reading this post until now, but I love that insight that understanding variation is key.
I was part of the revenue forecasting finance team at Google that set the estimates for how much money we’d make so that the company could decide how much it could plan to spend and maintain margins. When I got there in 2008, the errors were 10-20% on the annual forecast; a few years later, we were rarely off by more than 0.5-1% at the quarterly level, and 1-2% for the year, unless something had drastically changed (aka exceptional variation in the form of global economy changes).
A lot of the forecasting improvement was low-hanging fruit addressing normal variation - splitting up forecasts by country/region that behaved differently, understanding seasonality better (holidays around the world, weekdays vs. weekends, one-off events like the World Cup or the Olympics), tuning different algorithms for different products, using year-on-year and year-on-2year trends to understand outliers, etc.
As part of that, I developed my understanding of our revenue driver metrics so I could glance at a day when actuals were off from our forecast, and figure out in a few minutes whether it was something to look into more or not. I was the guy the VPs/execs looked at to tell them whether this was “normal variation” or something that needed greater investigation.
Data driven decisions without that intense understanding of the underlying data often just means leaders seizing on the numbers that support their pre-existing biases ![]()
[Cedric asked me how I developed that understanding without looking at variation charts]
In our case, it was looking at the year-on-year data split by country/region that was most helpful, plus also splitting revenue out by key subcomponents (e.g. click-through rate and cost-per-click). We had an internal dashboard that allowed us to split the revenue data along all of those axes, and it was incredibly helpful in building that intuition - I later learned from the team that built and maintained that dashboard that I was their #1 user by a mile ![]()
There’s an accumulation of little things like knowing that quarterly comparisons are tricky because they are different lengths (Q1 is 90 days due to February, compared to 91 days in Q2 or 92 days in Q3 and Q4), or knowing how Catholic countries in Southern and Eastern Europe have a much bigger slowdown due to Easter. There’s keeping track of yearly events so you can look at whether it’s this year that’s the outlier or last year when looking at weird y’y trends. There’s looking at the subcomponents as I mentioned - I remember one day when all the monitoring alerts fired because our revenue per query tanked, and we quickly realized it was because Michael Jackson had died, and we had a spike of queries about Michael Jackson that had no ads on them.
All of those intuitions were later codified into the forecasting algorithms (rather than doing a global forecast, the team automated doing y/y forecasts by country and region and summed them up, taking into account seasonal variations and holidays and other discontinuous events like the Olympics or World Cup) and passed on as knowledge to new people joining that revenue forecasting team, so it was no longer up to them to learn it as we did.
The details I’ve dealt with are different in some particulars, but the shape of this is familiar.
This is one context among many where the effort looks from the outside like tacit knowledge, but is well described from the inside as a concrete ‘accumulation of little things.’
Great series!
One thing I found a bit confusing, you write:
This in turn means that unpredictable processes cannot be easily improved upon
and directly below.
A business process that is unpredictable (that is, shows exceptional variation) can be easily improved upon …
Is this meant as an insight, like you first thought it can not but it turns out to be the opposite?
Ahh, I thought I made a terrible typo, but it turns out that I’d just made an unclear argument! (Which is perhaps the same … ![]() )
)
The core idea is that you can’t improve a process without first getting rid of the exceptional variation. But then … if you get rid of the exceptional variation … isn’t that improving the process?
Ugh, English.
I’m rewriting to go like this:
- A business process that is unpredictable (that is, shows exceptional variation) can be easily improved upon — in the sense that your first step is obvious: remove the sources of exceptional variation! You shouldn’t attempt to modify the process to hit your targets until you do so.
I’ve also removed the first sentence you quote for clarity!
In Wheeler’s follow-up book, Twenty Things You Need To Know, he has a chapter on where the scaling factors come from. The book itself is a very useful reference that answers some frequent questions that come up when people start using Process Behavior Charts.
Thanks for sharing that book, @jeremycolon! If you have a few minutes to list some of the 20 things, that would be incredibly helpful. (Sadly, Amazon doesn’t seem to have a look inside preview so I can’t even find a TOC online.)
Sorry for the delay @colin.hahn. Here is the chapter list: